Tourism Waves Shape Bingo Trends in Coastal Resort Areas
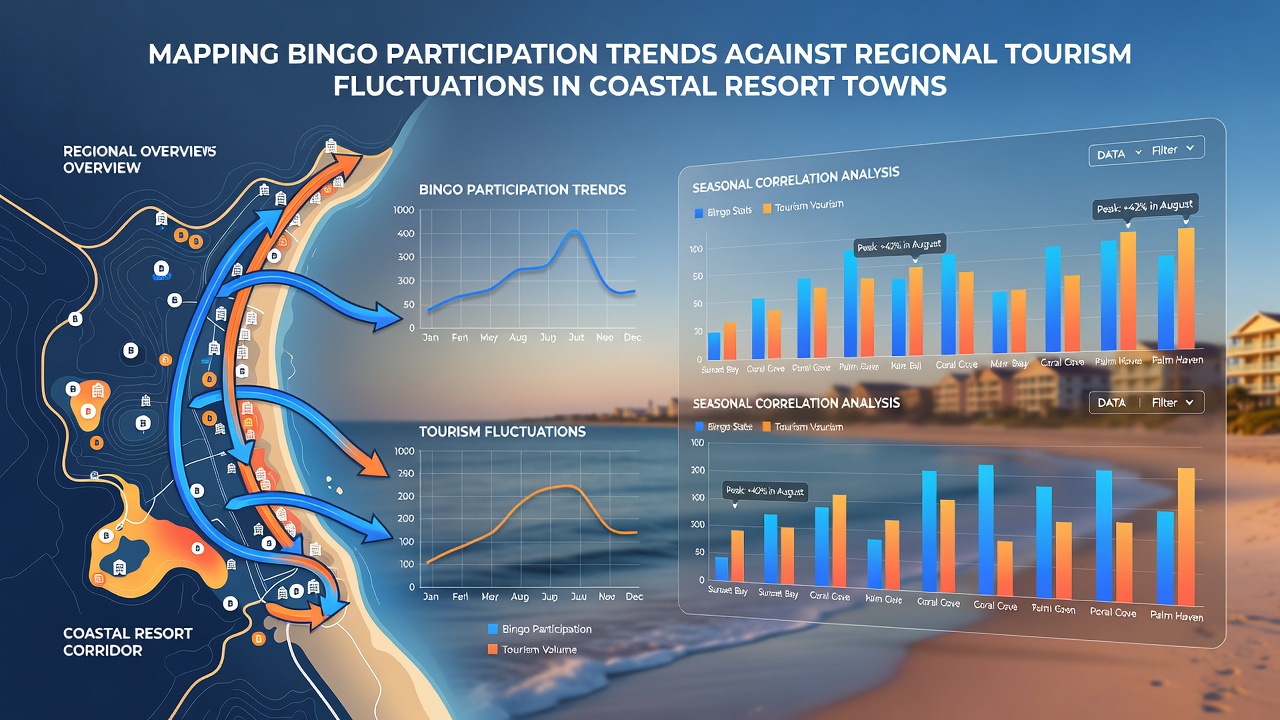
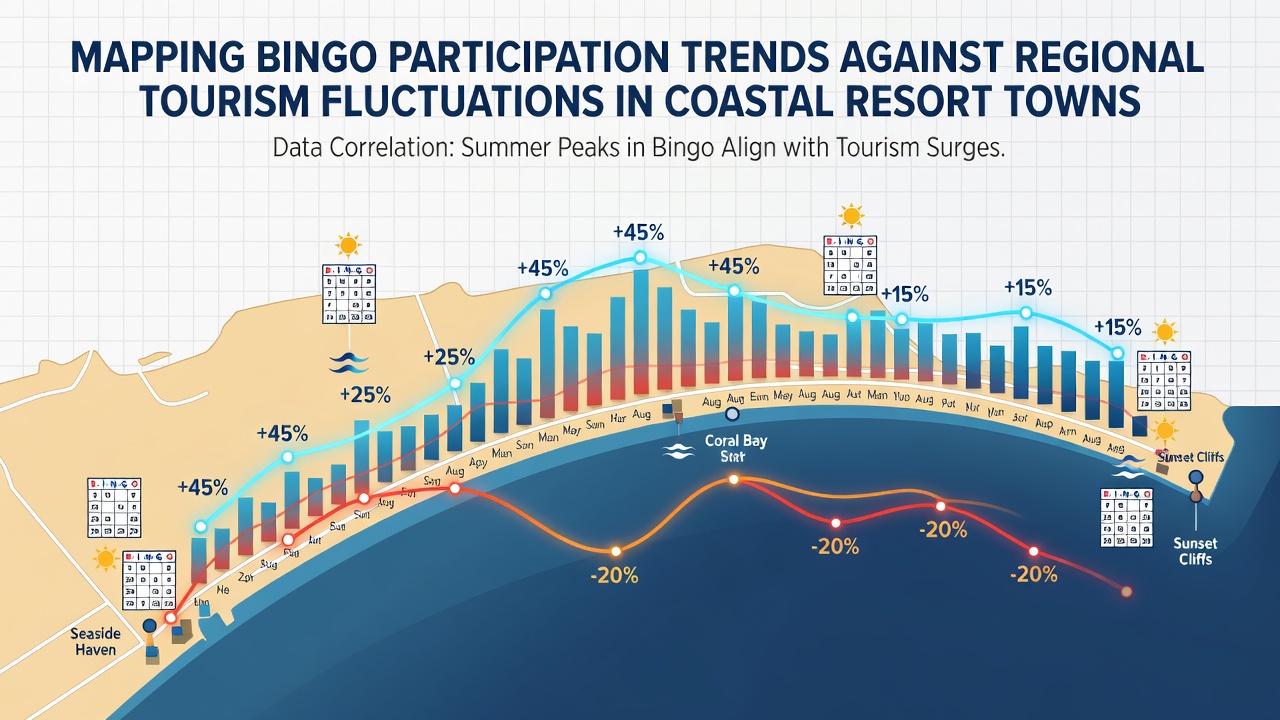 Coastal resort towns have long relied on seasonal visitor flows to sustain local economies, and bingo venues often sit right in the middle of those cycles. Data from multiple regions shows participation numbers rising and falling in step with hotel occupancy rates and flight arrivals, creating measurable patterns that operators track each year. Researchers at several universities have compiled venue attendance logs against tourism board statistics, revealing that bingo halls in places like the Jersey Shore and parts of the Spanish Costa del Sol experience 30 to 40 percent higher turnout during peak summer months. These spikes align directly with increased short-term rentals and cruise ship schedules, while shoulder seasons see steadier but lower local player bases.
Seasonal Data Patterns Across Regions
Figures collected from Atlantic City properties through 2025 demonstrate that bingo sessions during June typically draw larger crowds when tourism reports list hotel bookings above 85 percent capacity. The same datasets indicate participation drops sharply once summer ends and visitor counts decline, with some halls reporting 25 percent fewer cards sold in September compared to July.
Similar correlations appear in Australian coastal communities such as the Gold Coast, where state tourism statistics released by the Australian Bureau of Statistics show bingo event attendance tracking closely with domestic holiday travel peaks. Operators there adjust session times and prize structures ahead of known high-traffic periods to match expected demand.
Operational Adjustments in Response to Visitor Shifts
Venue managers in these markets have adopted data-driven scheduling that responds to tourism forecasts rather than fixed calendars. When regional reports predict slower shoulder seasons, halls often extend promotions or introduce themed nights aimed at year-round residents to stabilize revenue streams.
One documented case in the Mediterranean involved a chain of coastal bingo locations that reduced midweek sessions during low-tourism months while expanding weekend events that attracted both visitors and locals. Revenue remained consistent even as overall foot traffic varied with airline passenger numbers.
External Factors Influencing Participation
Weather events and infrastructure projects also play roles in these trends. Storms that disrupt beach access tend to push more visitors indoors toward entertainment options including bingo, while road construction that limits resort entry can reduce attendance for several weeks. Operators monitor these variables alongside standard tourism metrics to anticipate changes.
Studies examining multiple European coastal zones found that bingo participation sometimes increased during periods of moderate tourism decline when visitors extended stays due to flight cancellations, creating unexpected demand spikes that venues addressed through additional staffing and prize pools.
Longer-Term Trends and Planning
Over several years, analysts have noted that bingo operations in established resort towns maintain viability by diversifying beyond pure tourist reliance. Many facilities now incorporate loyalty programs that retain local players during off-peak periods, while still capitalizing on visitor surges when they occur. This dual approach appears in data from both North American and European markets.
June 2026 projections from several regional tourism offices suggest another strong summer season, with early booking indicators pointing to potential record arrivals in select coastal areas. Bingo venues in those locations have already begun aligning session calendars and marketing efforts with those forecasts to capture the expected uptick in participation.
Conclusion
Patterns linking bingo participation to tourism fluctuations continue to guide operational decisions in coastal resort communities worldwide. Consistent data collection and cross-referencing with visitor statistics allow venues to maintain steady activity levels despite seasonal swings. As tourism patterns evolve, these mapping efforts provide a practical framework for anticipating and responding to changes in player numbers across different regions.